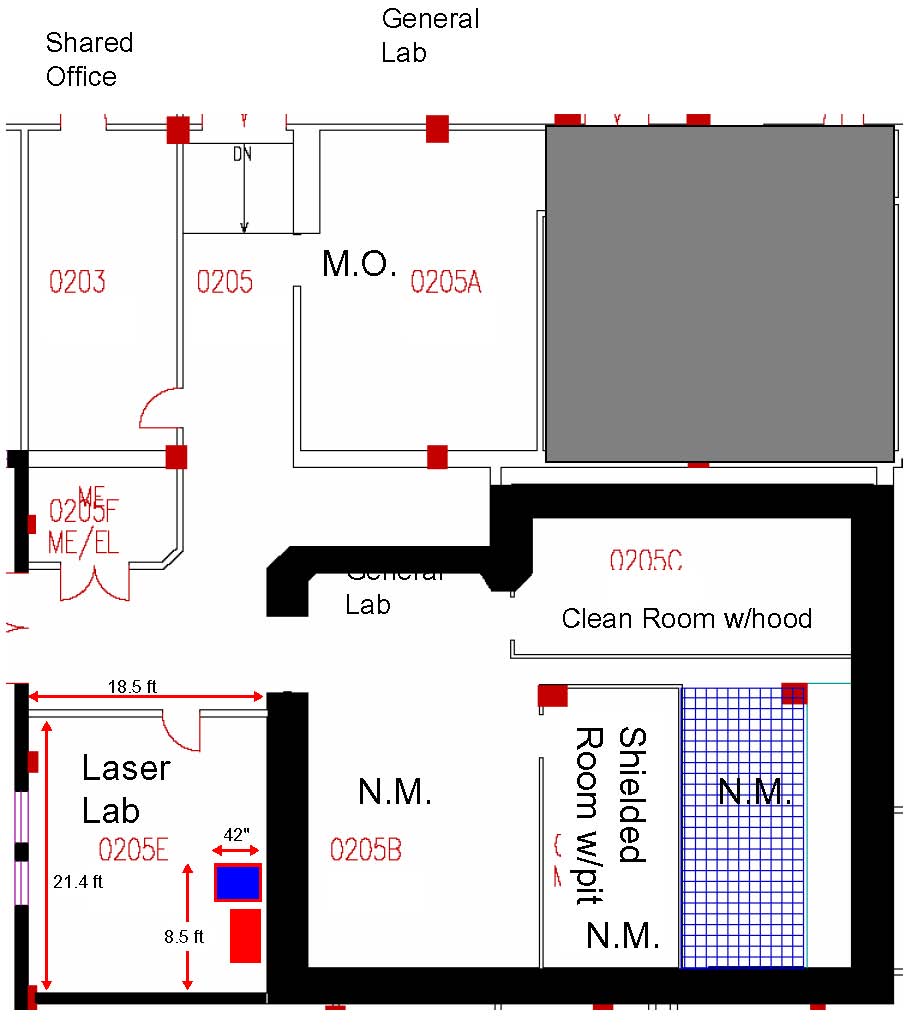
Here is the floorplan in the basement where the new nano labs will be located. I think we've all seen the layout here. Towards the top of the page is west, towards the right is north.
The laser lab will be in 0205E. We put a temp/humidity sensor in that lab against the west wall just to the right of the door as you walk into the lab. It is behind a bookcase, so it's somewhat isolated from the doorway opening, but not completely. We took readings from Friday, April 23rd until Tuesday, April 27th for a total of 80 hours. The sensors are not so accurate, but over time we would get enough statistics to see what we can see.
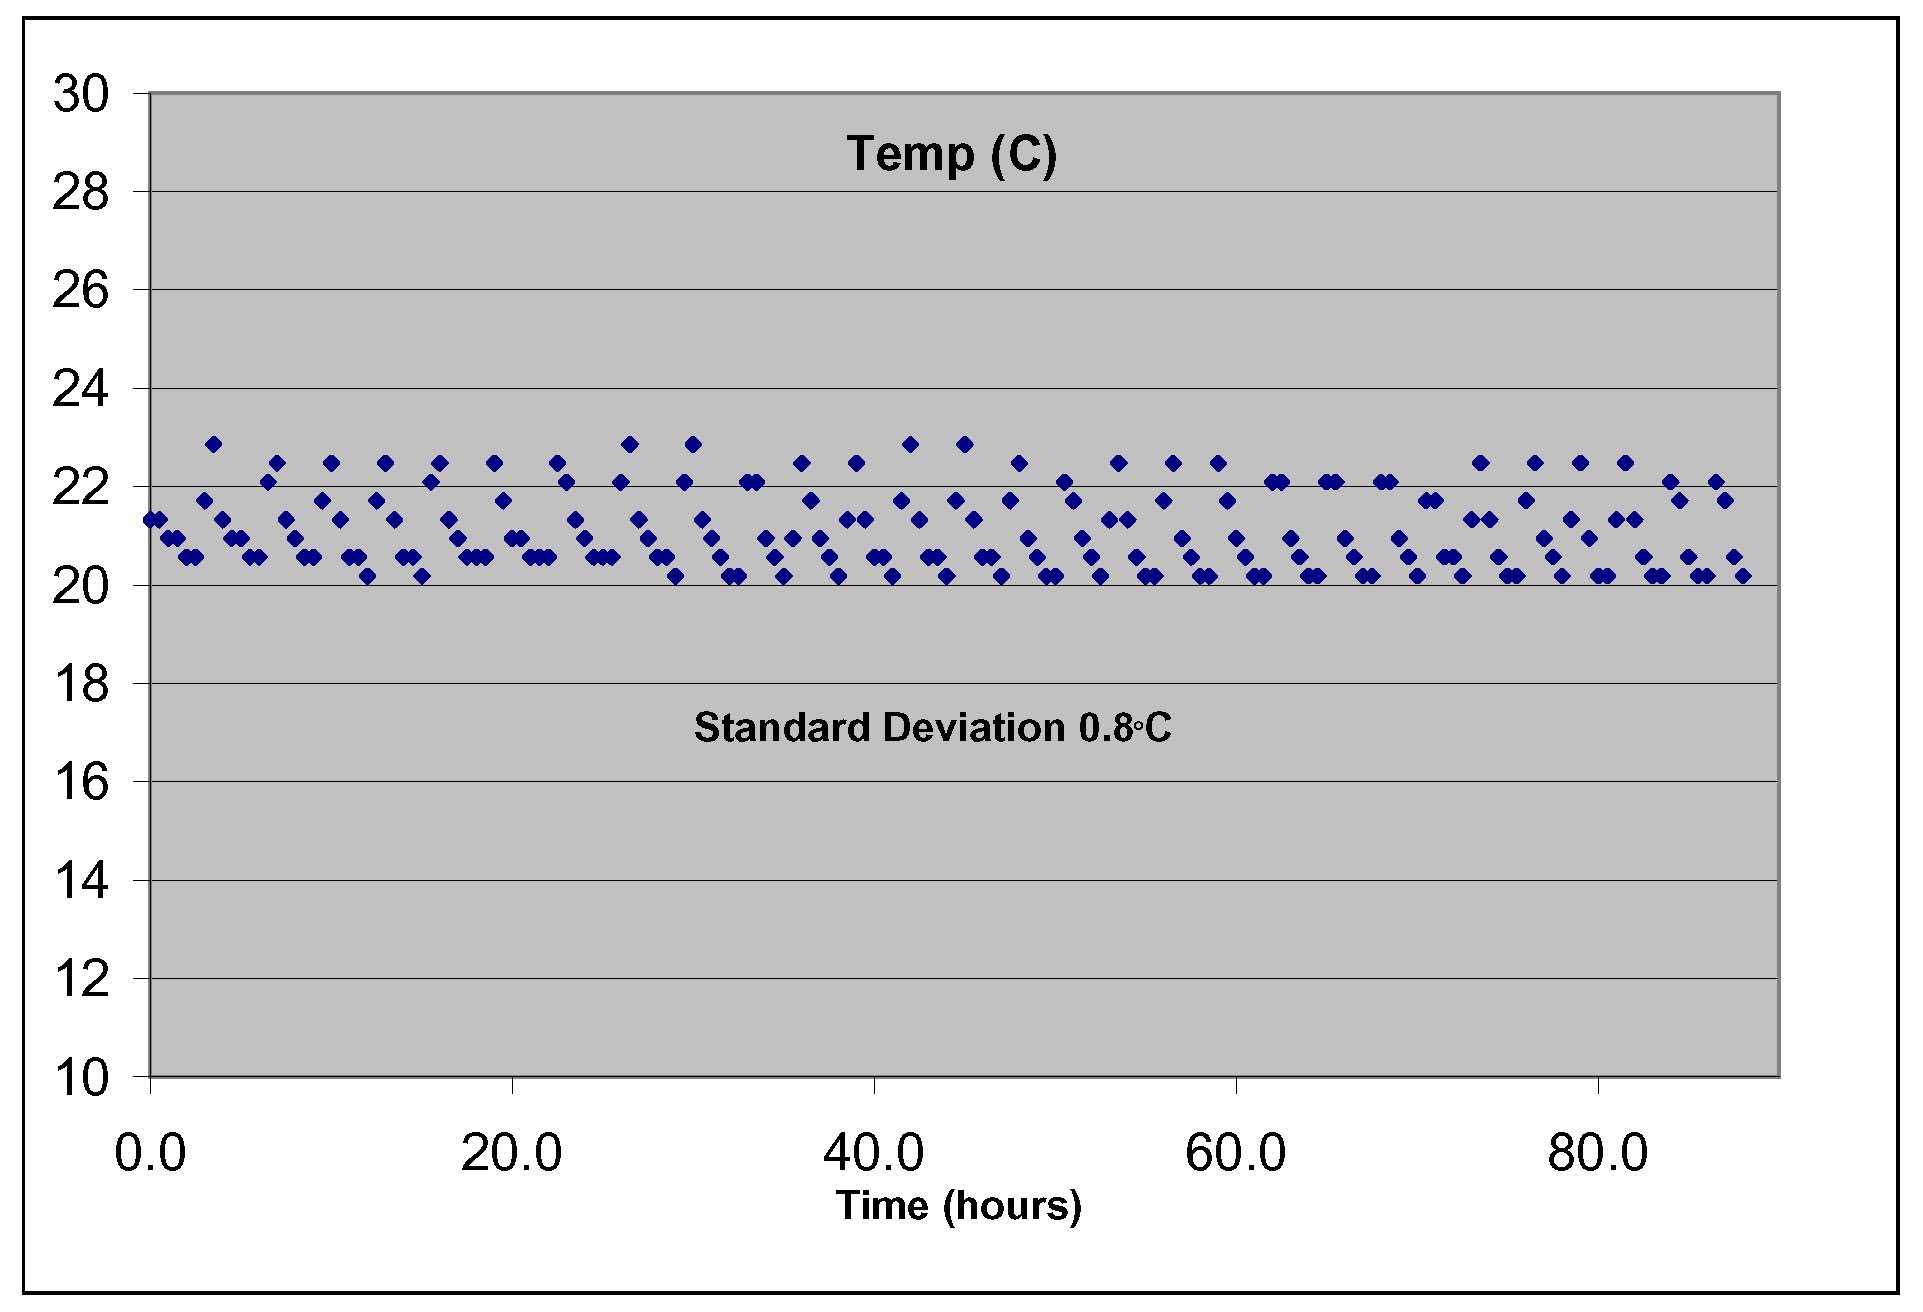
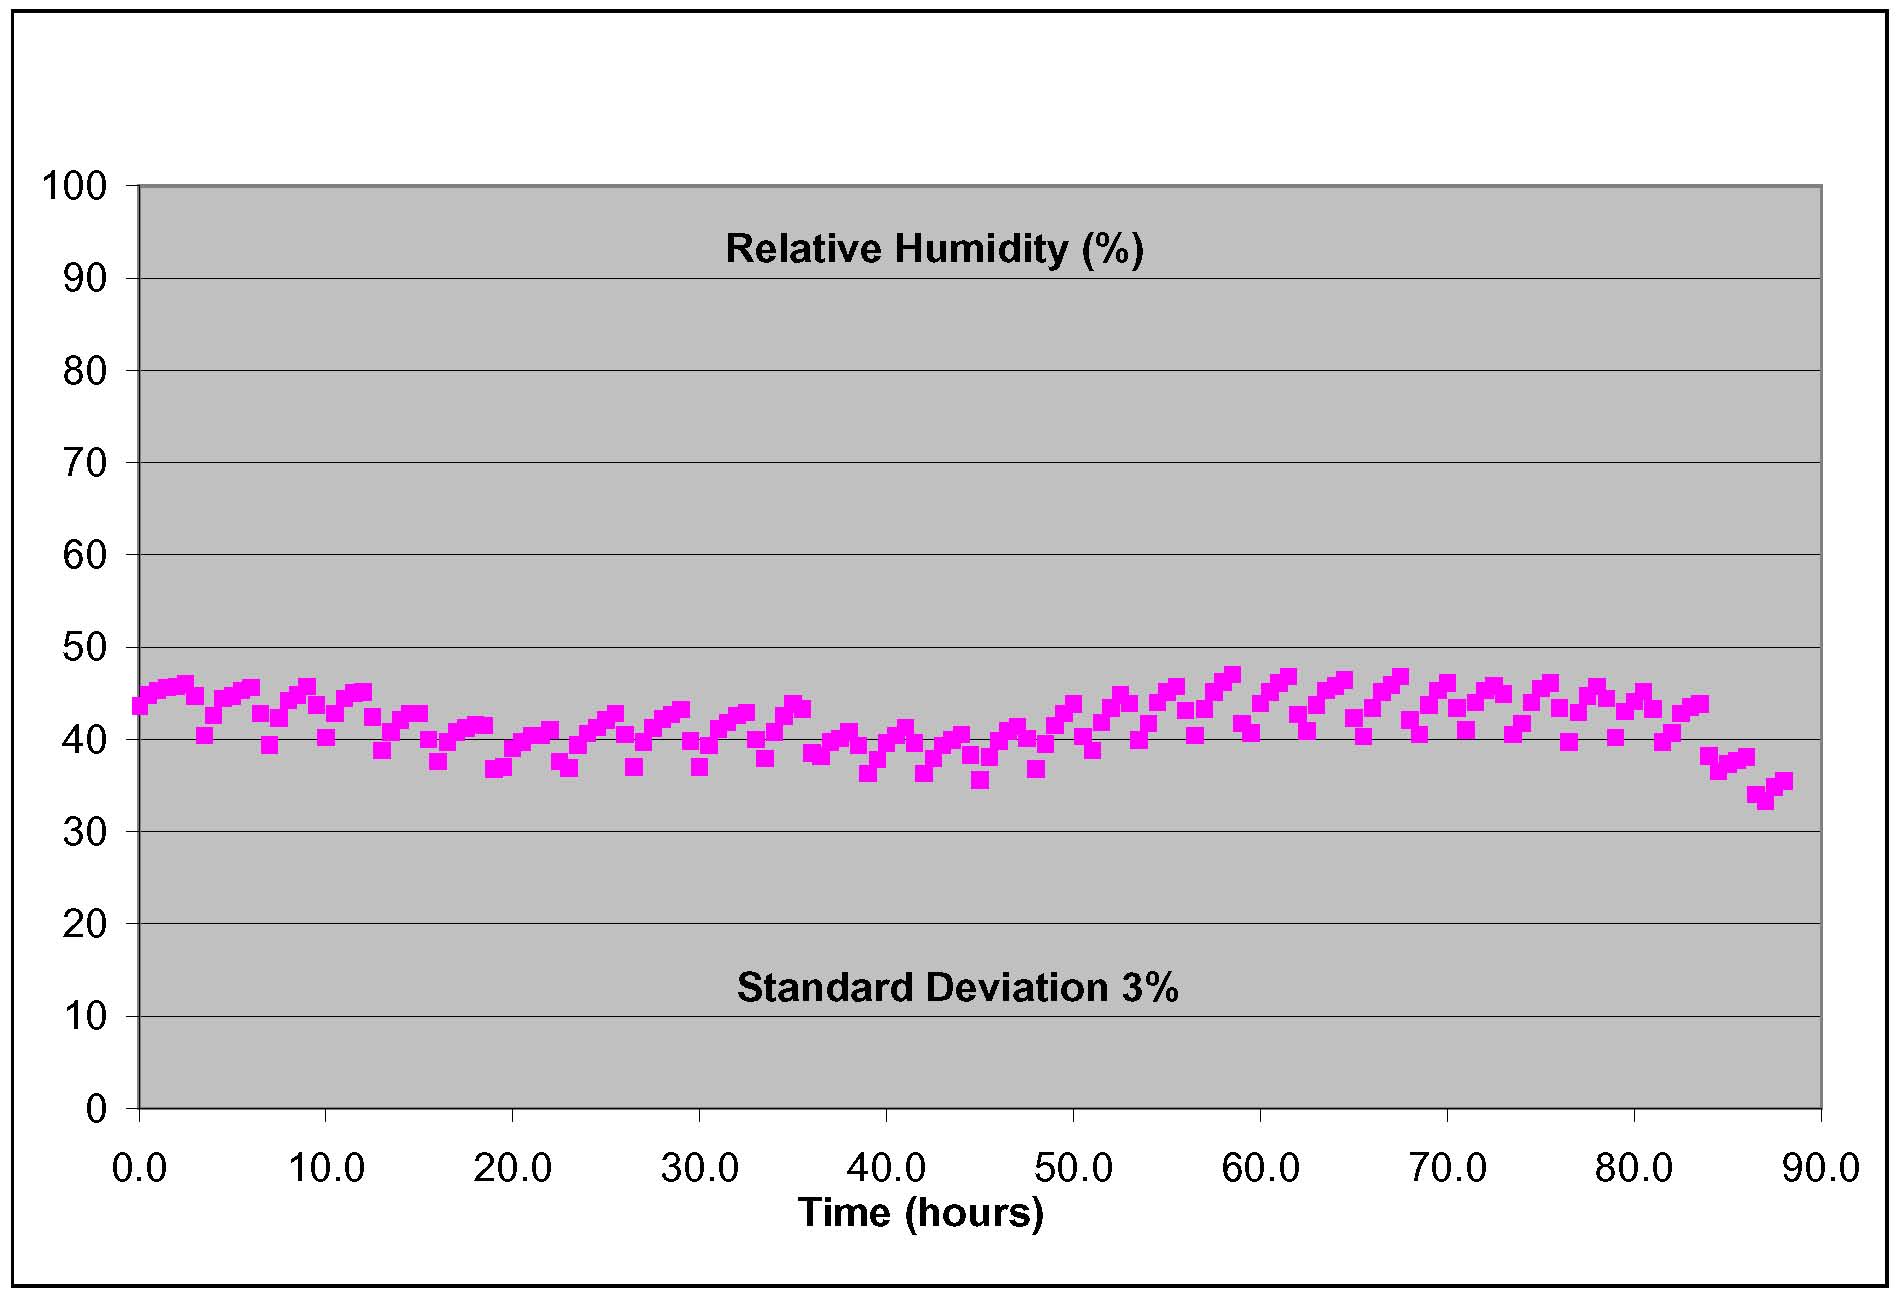
Here are the plots. We see a temperature variation of 0.8C (standard deviation) and a relative humidity change of 3%. The plots clearly show the quantization of the measurements, and we could do better with better sensors, but I think that for now this is good enough since the variations are within the limits. Min, please check this so that there is no misunderstanding. One thing that is curious is the periodicity in the RH plot - we're pushing campus to put in more sensors to see if we can figure out if this is some quirk in the sensor, some hysteresis effect somewhere, feedback, etc. We don't think it's a problem - we think it's more to do with the way the data was gathered, and we'll pursue this.
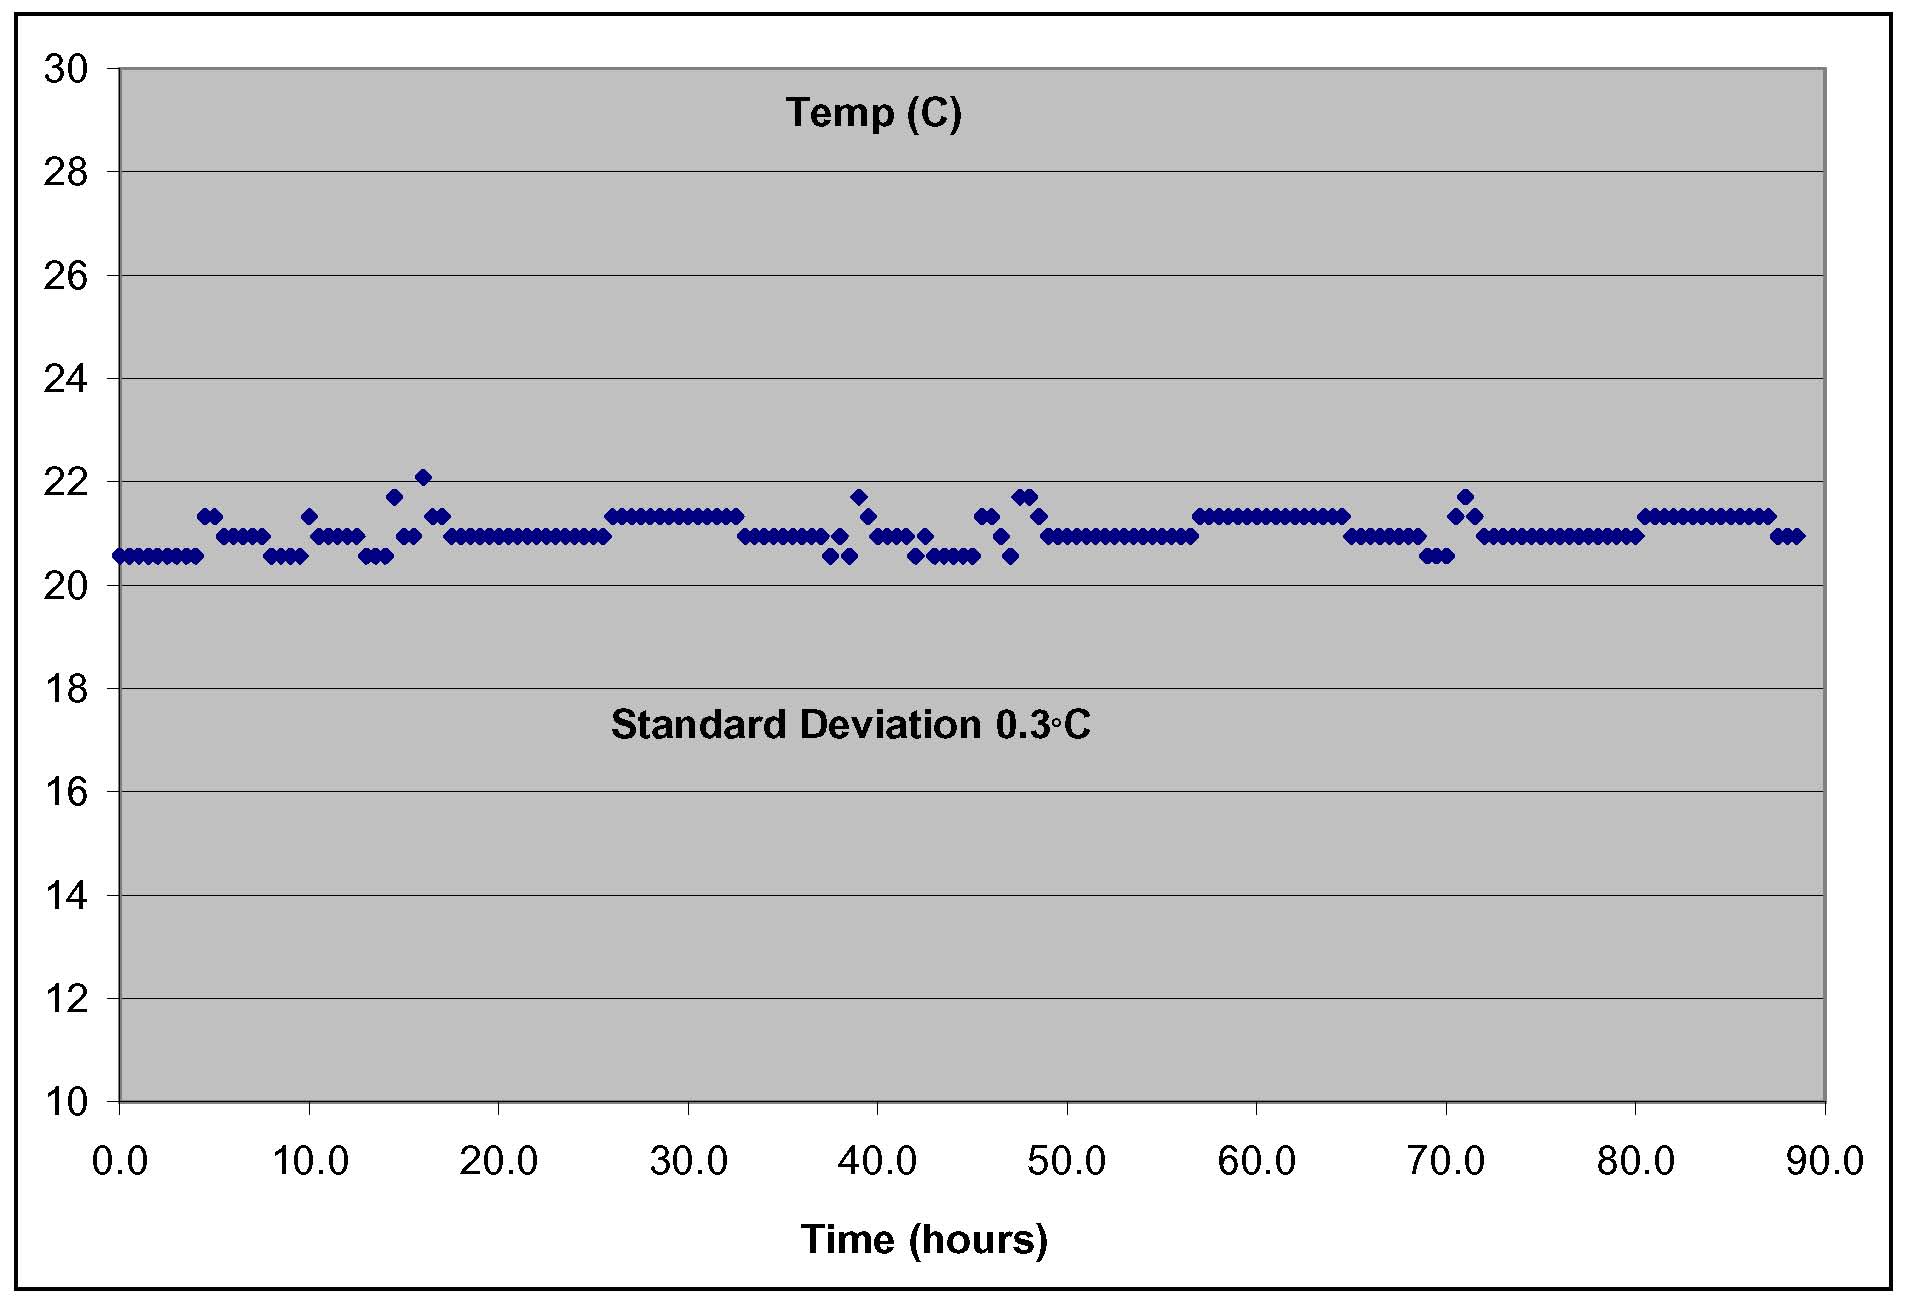
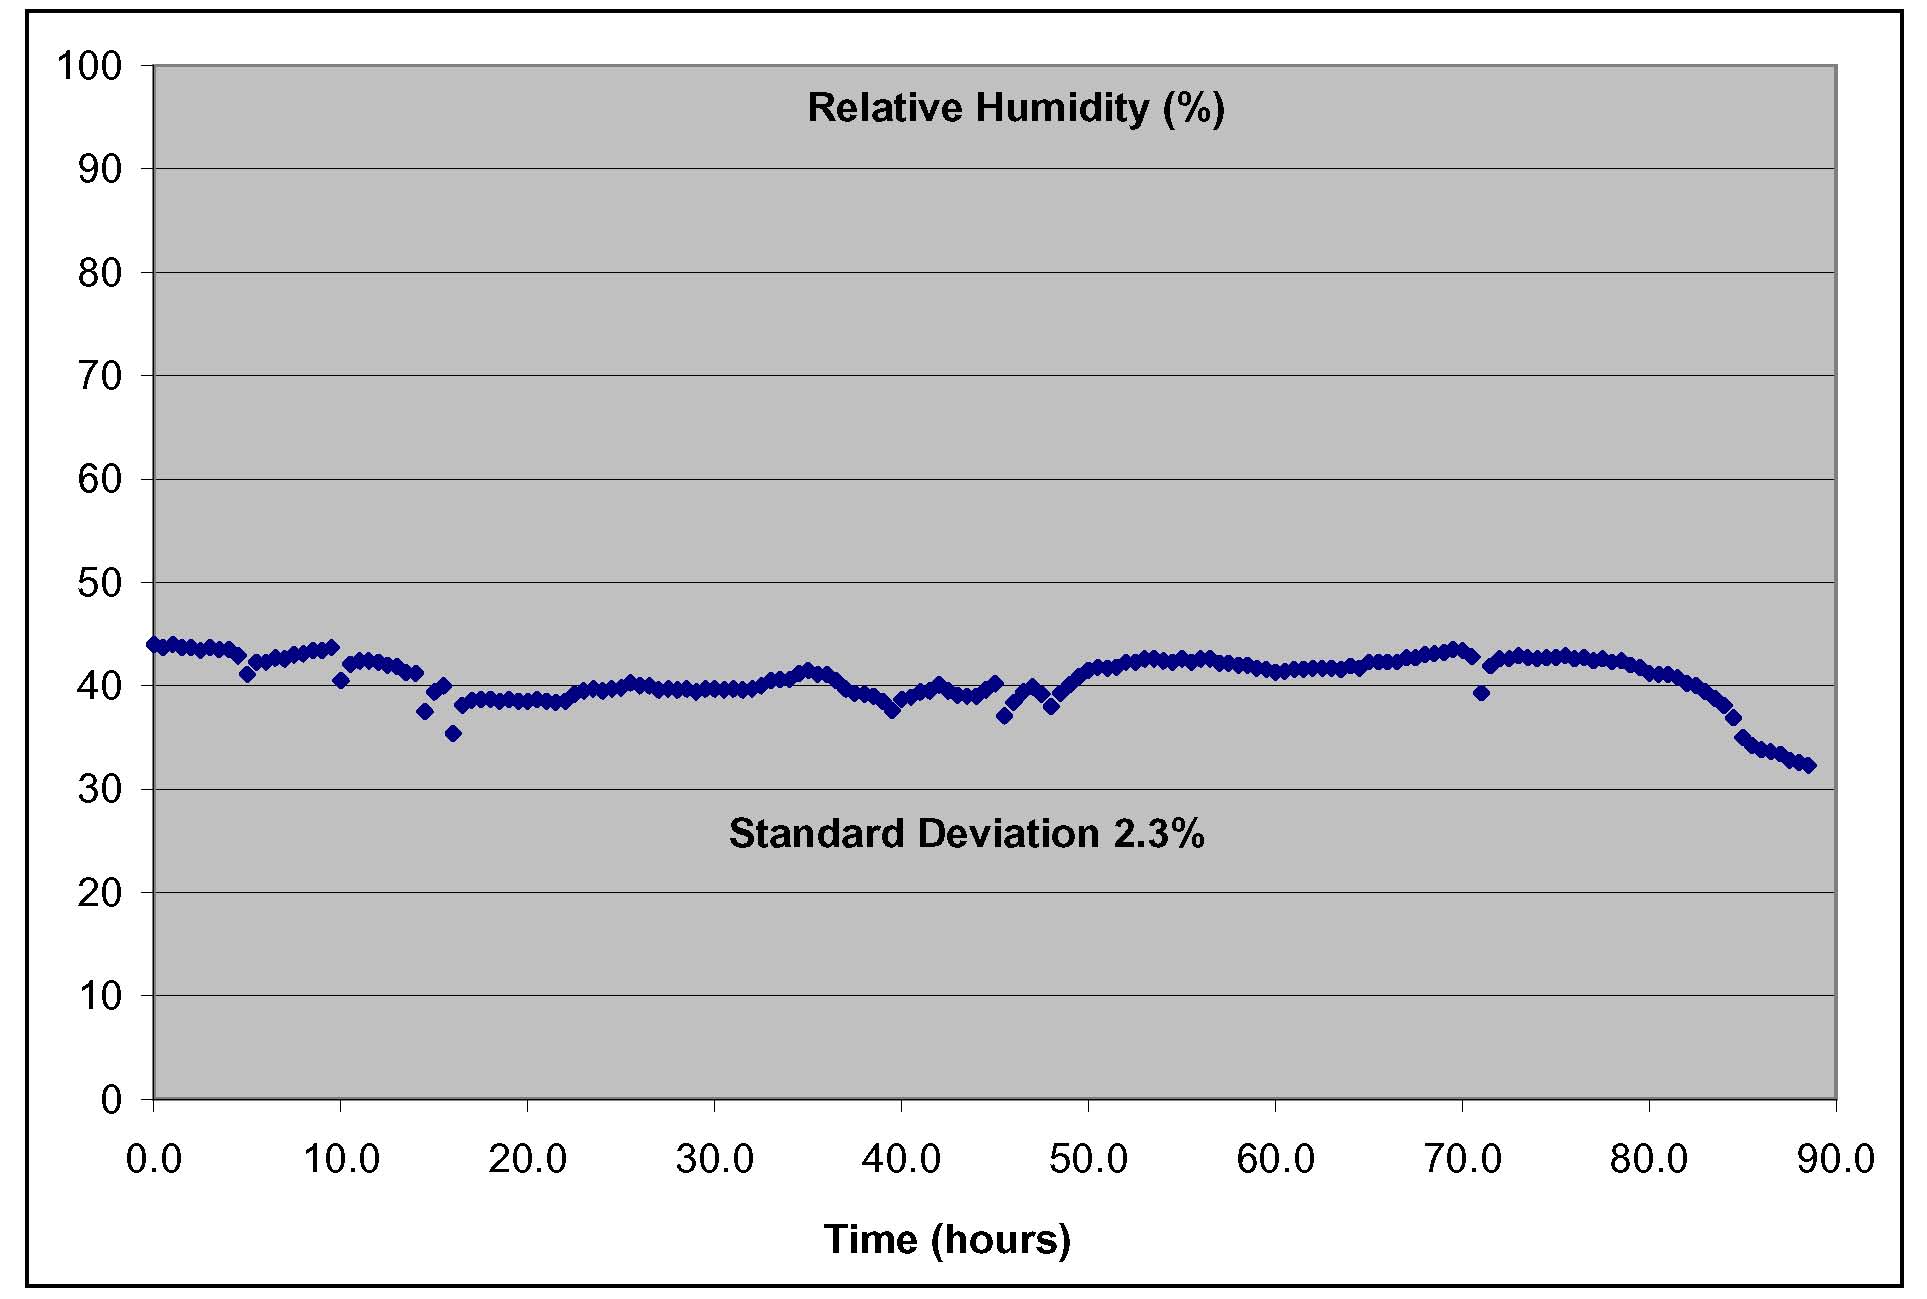
We also put a sensor in Webb's area, 0205B. This sensor was in the shield room, against the west wall (in the picture, it's in the room that is labeled "Shielded Room w/pit" and it is right "above" the R in "Room"). The temperature variation measured there was 0.3C and the relative humidity change was 2.3% over the 80 hours. It is less over a shorter time period. Note that the data in this room is only to illustrate that in a more controlled environment, the variations are smaller. Note also that we don't see the same periodicity in the RH plot here - under investigation...
 .
.