| Homework due Sept. 15 |
Name: |
Section: |
3. Velocity graphs
An object's motion is restricted to one dimension along the + distance axis. Answer each of the questions below by selecting the velocity graph that is the best choice to describe the answer. You may use a graph more than once or not at all.

- Which velocity graph shows an object going away from the origin at a steady velocity?
- Which velocity graph shows an object that is standing still?
- Which velocity graph shows an object moving toward the origin at a steady velocity?
- Which velocity graph shows an object changing direction?
- Which velocity graph shows an object that is steadily increasing its speed?
4. Blast off!
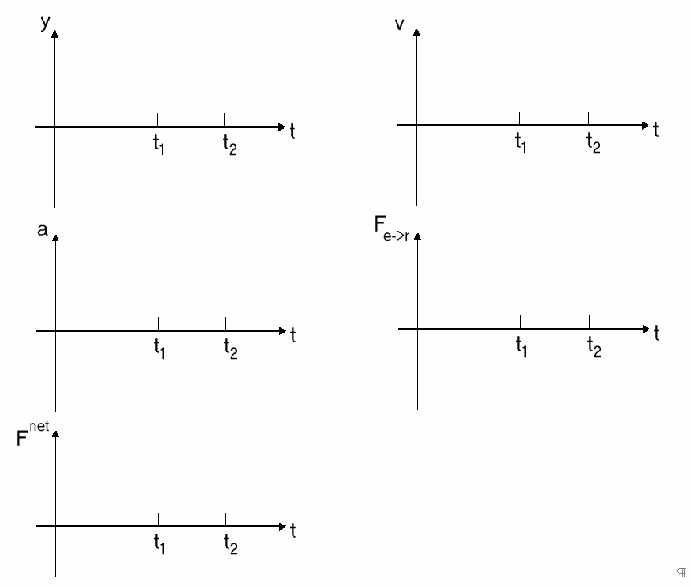
A two stage rocket starts firing its engines at a time t = 0. From that instant, it begins to move upwards with a constant acceleration. This continues until a time t1. The rocket drops the first stage and continues upward briefly until a time t2 at which point the second stage begins to fire and the rocket again accelerates upward, this time with a larger (but again constant) acceleration. Sometime during this second period of acceleration, our recording apparatus stops.
- On copies of the graphs below, sketch qualitatively accurate (i.e., we don't care about the values but we do about the shape) graphs of each of the height of the rocket, y, its velocity, v, its acceleration, a, the force of the engine on the rocket, Fe->r, and the net force on the rocket, Fnet. Take the positive direction as upward.
- How can you check for coherence between your acceleration and your net force graph? Briefly explain how to do it and explain why that strategy works.
5. Racing model cars
The position (in meters) as a function of time of four model racecars moving smoothly along long parallel paths is given in the table at the right. The data is from the middle portion of a race. Assume that the racecars moved smoothly between the times listed.
|
t = 5 sec |
t = 6 sec |
t = 7 sec |
t = 8 sec |
t = 9 sec |
t = 10 sec |
| red |
5 | 7 | 11 | 17 | 25 | 35 |
| yellow |
28 | 39 | 50 | 61 | 72 | 83 |
| blue |
43 | 52 | 61 | 70 | 79 | 88 |
| green |
13 | 16 | 20 | 25 | 31 | 38 |
(a) Which of the racecars, if any, moved with constant speed between t=5 sec and t=10 sec? Explain your reasoning.
(b) Which of the racecars had the largest velocity at t=8 sec? Explain how you can tell.
(c) What was the acceleration of the green racecar at t=8 sec? Explain how you arrived at your answer.