1) In this problem we analyze the phenomenon of "tailgating"
in a car on a highway at high speeds. This means traveling too close behind
the car ahead of you. Tailgating leads to multiple car crashes when one
of the cars in a line suddenly slows down. The question we want to answer
is: "How close is too close?"
To do this, let's suppose you are driving on the highway at a speed
of 100 kilometers an hour (a bit more than 60 mph). The car ahead of you
suddenly puts on its brakes. We need to calculate a number of things: how
long it takes you to respond; how far you travel in that time; how far
the other car traveled in that time.
First let's estimate how long it takes you to respond. Two times are
involved: how long it takes from the time you notice something happening
till you start to move to the brake, and how long it takes to move your
foot to the brake. You will need a piece of paper (8.5x11), a meter stick,
and a coin to do this.
Take a piece of paper and have a friend hold the paper from the middle
of one of the short sides hanging straight down. Place your thumb and forefinger
opposite the bottom of the paper. Have your friend release the paper suddenly
and try to catch it with your thumb and forefinger. Measure how far the
paper fell before you caught it. Do this three times and take the average
distance. Assuming the paper was falling freely without air resistance
(not bad for the paper falling sideways), calculate how much time it took
before you caught it, t1.
(a) Estimate the time it takes you to move your foot from the gas pedal
to the brake to be t2 = 0.5 s. Your reaction time is t1
+ t2.
(b) If you brake hard and fast, you can bring a typical car to rest from
100 kph (about 60 mph) in 5 seconds. Calculate your acceleration, a0,
assuming that it is constant.
(c) Suppose the car ahead of you begins to brake with a (negative) acceleration
a0. How far will he travel before he comes to a stop? (Hint:
How much time will it take him to stop? What will be his average velocity
over this time interval?)
(d) You see him start to slow immediately (an unreasonable but simplifying
assumption). If you are also traveling 100 kph, how far (in meters) do
you travel before you begin to brake? If you can also produce the acceleration
a0 when you brake, what will be the total distance you travel
before you come to a stop?
(e) If you don't notice the car ahead of you beginning to brake for 1 second,
how much additional distance will you travel?
(f) Discuss, on the basis of these calculations, what you think a safe
distance is to stay behind a car at 60 mph. Would you include a safety
factor beyond what you have calculated here? How much?
2) An unrestrained child is playing on the front seat of a car traveling
in a residential neighborhood at 35 km/h. (How many mph is this?) A small
dog runs across the road and the driver applies the brakes, stopping the
car and missing the dog. With what speed does the child strike the dashboard,
presuming that the car stops before the child does so? Compare this speed
with that of the world-record 100 m dash, which is run in about 10 s.
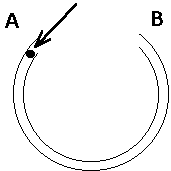
3) A small ball is projected into a narrow, frictionless tube bent into
the arc of a circle and lying flat on a horizontal table at the
point A as shown in the picture on the right. If you ignore the friction
between the ball and the table, what path will the ball follow when it
leaves the tube at B? Explain your reasoning.
4) The figure below shows the velocity graph of a cart moving on an
air track. The track has a spring at one end and has its other end raised.
The cart is started sliding up the track by pressing it against the spring
and releasing it. The clock is started just as the cart leaves the spring.
Take the direction the cart is moving in initially to be the positive x
direction and take the bottom of the spring to be the origin.
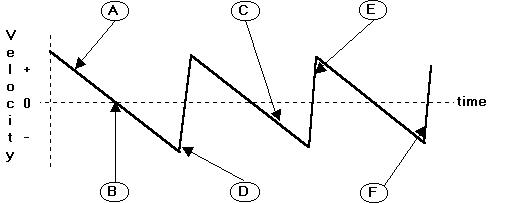
Letters point to six points on the velocity curve. For the physical
situations described below, identify which of the letters corresponds to
the situation described. You may use each letter more than once, more than
one letter may be used for each answer, or none may be appropriate. If
none is appropriate, put the letter N.
(a) This point occurs when the cart is at its highest point on the track.
(b) At this point, the cart is instantaneously not moving.
(c) This is a point when the cart is in contact with the spring.
(d) At this point, the cart is moving down the track toward the origin.
(e) At this point, the cart has acceleration of zero.
5) The figure below represents the position vs. clock reading of the
motion of two balls, A and B, moving on parallel tracks.
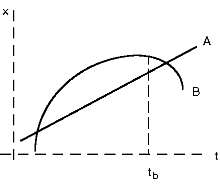
Carefully sketch the figure on your paper and answer the following questions:
(a) Mark with the symbol ta along the t-axis any instant
or instants at which one ball is passing the other.
(b) Which ball is moving faster at clock reading tb?
(c) Mark with the symbol tc along the t-axis any instant or
instants at which the balls have the same velocity.
(d) Over the period of time shown in the diagram, which of the following
is true of ball B? Explain your answer.
- (1) It is speeding up all the time.
- (2) It is slowing down all the time.
- (3) It is speeding up part of the time and slowing down part of the
time.
6) In the figure below is shown a graph of the velocity of a young boy
riding his bicycle as a function of time. Write a "story" describing
the boy's actions that lead to this graph (keep it short!) and pose an
end-of-chapter physics problem that could be solved using the graph. 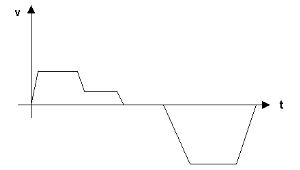
7) A motorized dune buggy is moving along an elliptical track. A picture
of the track with a choice of coordinate system is shown in the figure
at the top of the next page. Each tic mark along the x and y axes represents
a distance of 100 meters.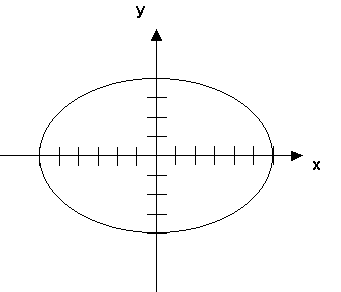
(a) The driver drives around the track three times keeping her speedometer
reading at a constant 35 miles per hour. Redraw the ellipse and its coordinate
system. During her second circuit of the ellipse, draw onto your picture
vectors indicating her position (use a single arrow), her velocity (use
a double arrow) and her acceleration (use a fat arrow) when she is at the
positions

(b) As she begins her fourth circuit round the track, she begins to
speed up when she reaches the point {600 m, 0} and continues speeding up
at a uniform rate until she reaches the point {-600 m, 0} and is traveling
at a speed of 50 mph. Draw another ellipse and draw velocity vectors (use
a double arrow) to indicate her velocity when she is a few meters before
the point {0, 400 m} and a few meters after that point. Draw her acceleration
arrow (use a fat arrow) when she is at the position {0, 400 m}.
(c) A viewer proposes that the equations describing her motion during the
first three circuits would be

with a = 600 m and b = 400 m. Do you agree with the viewer? If so, explain
why you think so. If not, explain how you would correct the equation.
8) A cart can move to the right or left along a horizontal track (the
positive part of the x axis) as shown in the figure below. Assume that
friction is small enough that it can be ignored. A sonic range is used
(as shown) to measure the position, velocity, and acceleration of the cart.
The track is not necessarily flat or horizontal. In addition, the track
may be tipped or the cart may be pulled or pushed.

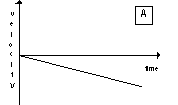
| (a) For the first run, the sonic ranger displays a graph of the velocity
that looks like the graph labeled A shown at the right. Copy the
graph and draw graphs showing what the sonic ranger would display for
In addition
|
 |
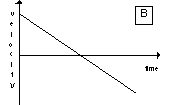
(b) For the second run, the sonic ranger displays of graph
of the velocity that looks like the graph labeled B shown at the
right. Repeat the tasks of part (a) for this case.
|
 |


![]()