University of Maryland Physics Education Research Group
 |
Physics Software from the UMd PERG:
Pulses -- A Pulse on a String Simulation |
I. D. Johnston, M. A. Oldfield, University of Sydney
E. F. Redish, University of Maryland
Download File (46 KB)
Brief description
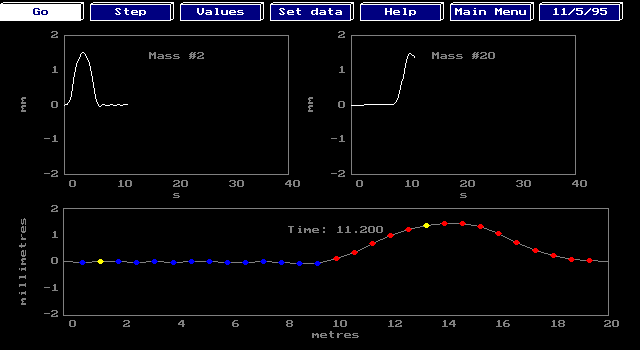
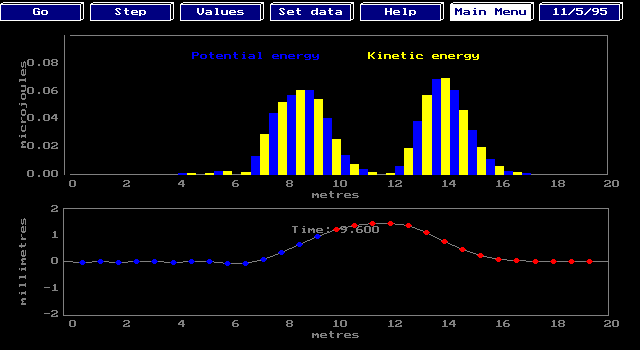
This program displays and solves for the motion of up to 50 identical masses connected by identical springs. A pulse is started by moving the first mass up, then down to its starting position. The program displays an animation of the masses and spring and either time graphs of the position and/or velocity of specified masses or an animated display of the energy localized in each mass and spring. The magnitude of the masses on the left and right sides may be set independently.
Pedagogical utility
The program allows the student to view the motion of a pulse. The separation of inertial and force characteristics into masses and springs allows the student to learn to separate the motion of the mass elements of the string from the motion of the wave pattern. It helps the student make the link between the ideas of Newtonian mechanics and the concept of waves in mechanical systems. It provides a good introduction to the reflection and transmission of waves at a boundary.
Appropriate for
- High school AP physics
- Introductory algebra-based physics
- Introductory calculus-based physics
- Specialized classes on waves
Screen views

Fig. 1: Display of pulse with the time display of two masses.

Fig 2: The display of the pulse with local kinetic and potential energies shown.
Availability
The code may be downloaded by clicking here.
(46K)
The file is a zip file. Unpack it using WinZip.
You will then find the following files in your directory:
- egavga.bgi (6K) -- the graphics driver for the file
- pulses.exe (78K) -- The main executable
If you are running under Windows, be certain the computer knows where the file is and what directory it is in. To check this, right click on the program icon and choose "Properties." On the tab "program" make sure the full address of the program is correct. The "start-up directory" should be the directory containing the program.
Technical information
The first mass on the left is moved by the function for 0 < t < t0. The user may set A and t0. The boundary conditions on the right are chosen to be impedance matched so there is no reflection from the end.
The equations of motion are solved using either the Euler or half-step method (user's choice). The user may also change the value of the mass and spring constant. Values may be read off the graphs.
Program help
The menu items on the menu you see first (the main menu) do the following things:
- SET DATA :
- Allows you to set the parameters of the problem
- GRAPHS:
- Plots the graphs.
- OPTIONS:
- Allows you to change what is displayed or the solution method.
- HELP:
- Brings up a screen describing what the menu items do.
- QUIT:
- Ends the program.
Select SET DATA and press . The first time you do this you will see the option screen. It allows you to
change the numerical method by which the equations are solved (This feature is not implemented in the current version.)
change whether you display graphs of the time dependences of the postions or velocities of two of the masses or
an animated energy display.
If you choose time dependences (the default value) you can choose which masses' properties you want displayed and whether you want to look at their position or their velocity.
If you press from the options screen, you will now see the data-entry screen. The parameters of the problem are shown on this screen. The numbers the program is currently using are shown in the black boxes. You can change any of them by typing over the numbers that are there. Use the arrow keys to change your position on the data-entry screen. For now, just look at the numbers. Press to accept this data.
Notice that there are now three graph windows. The bottom one displays an animation of the motion of the springs. The top two graphs plot the position of two of the masses. You set which ones in the OPTIONS screen described below.
Also notice that the menu has changed. This is the graph menu. The entries are selected and activated in the same way as those of the main menu, by highlighting them with the arrow keys and pressing . The entries do the following things:
- GO
- Starts the animation. Pause it by pressing .
- STEP
- Moves a paused animation by one time step.
- VALUES:
- Allows you to read a point off a graph using the mouse cursor.
- SET DATA
- Brings you back to the data entry screen.
- HELP:
- Brings up a screen describing what the menu items do.
- MAIN MENU:
- Returns to the main menu.
Contact person
E. F. Redish,
University of Maryland,
College Park, MD 20742;
phone: 301-405-6120,
fax: 301-314-9531,
e-mail: redish@physics.umd.edu


![]()